Evolution of a Grafana-Powered Home Automation Dashboard
 Grafana Dashboard Evolution: From Concept to Version 2.0
Evolution of a Grafana-Powered Home Automation Dashboard
From Idea to Reality: Version 1.0
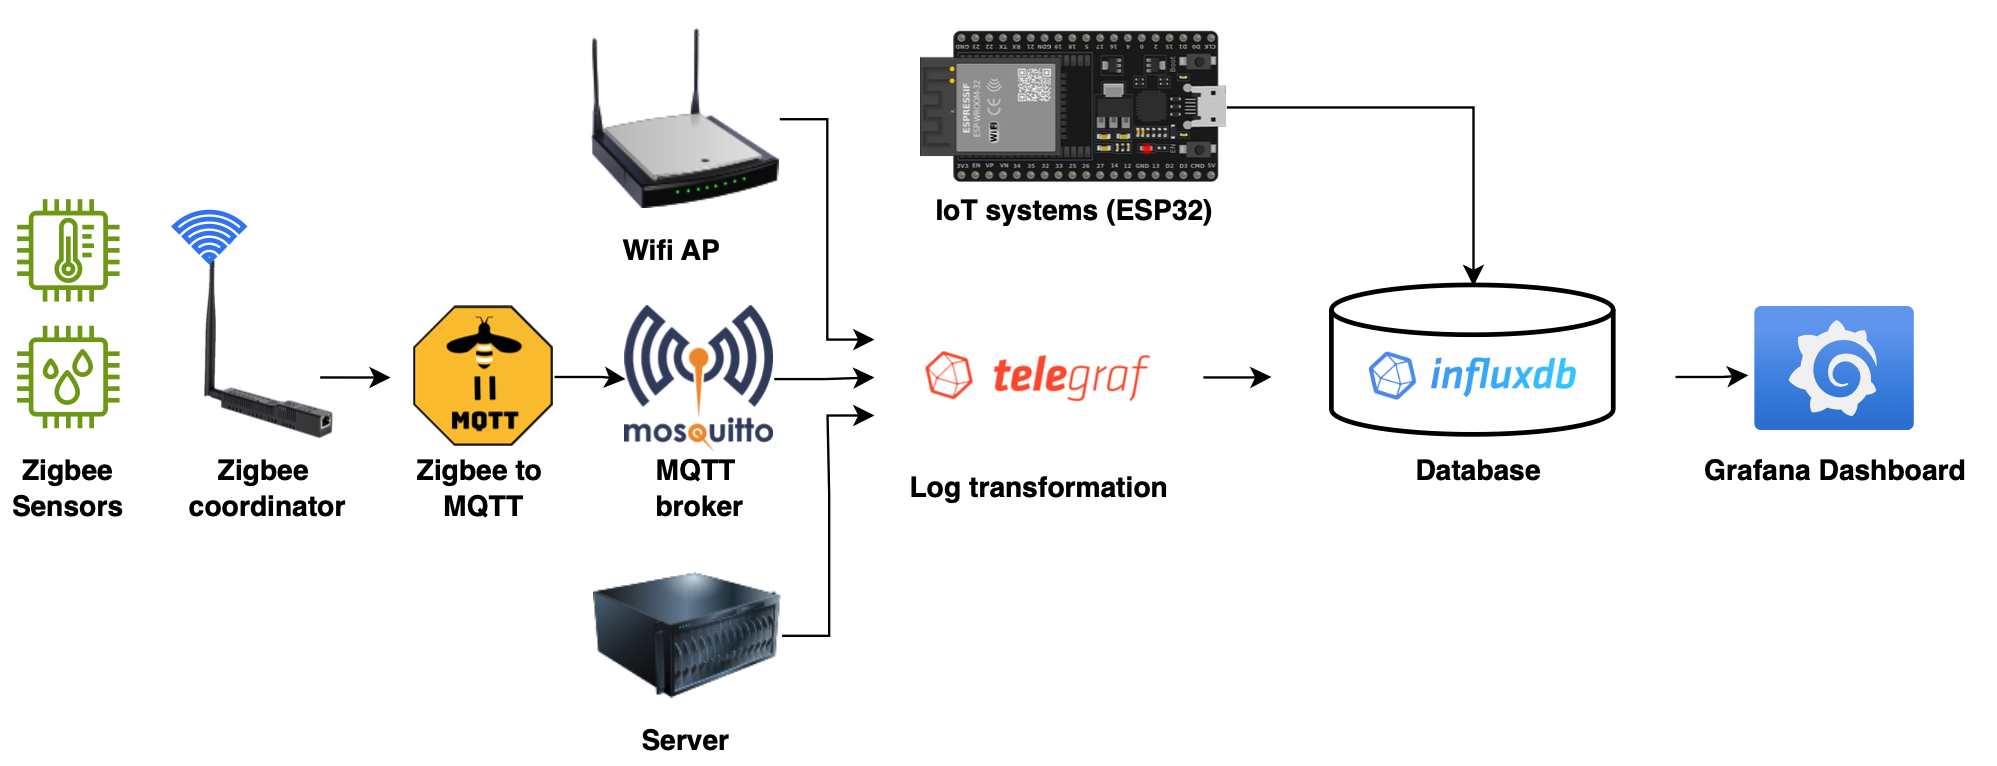
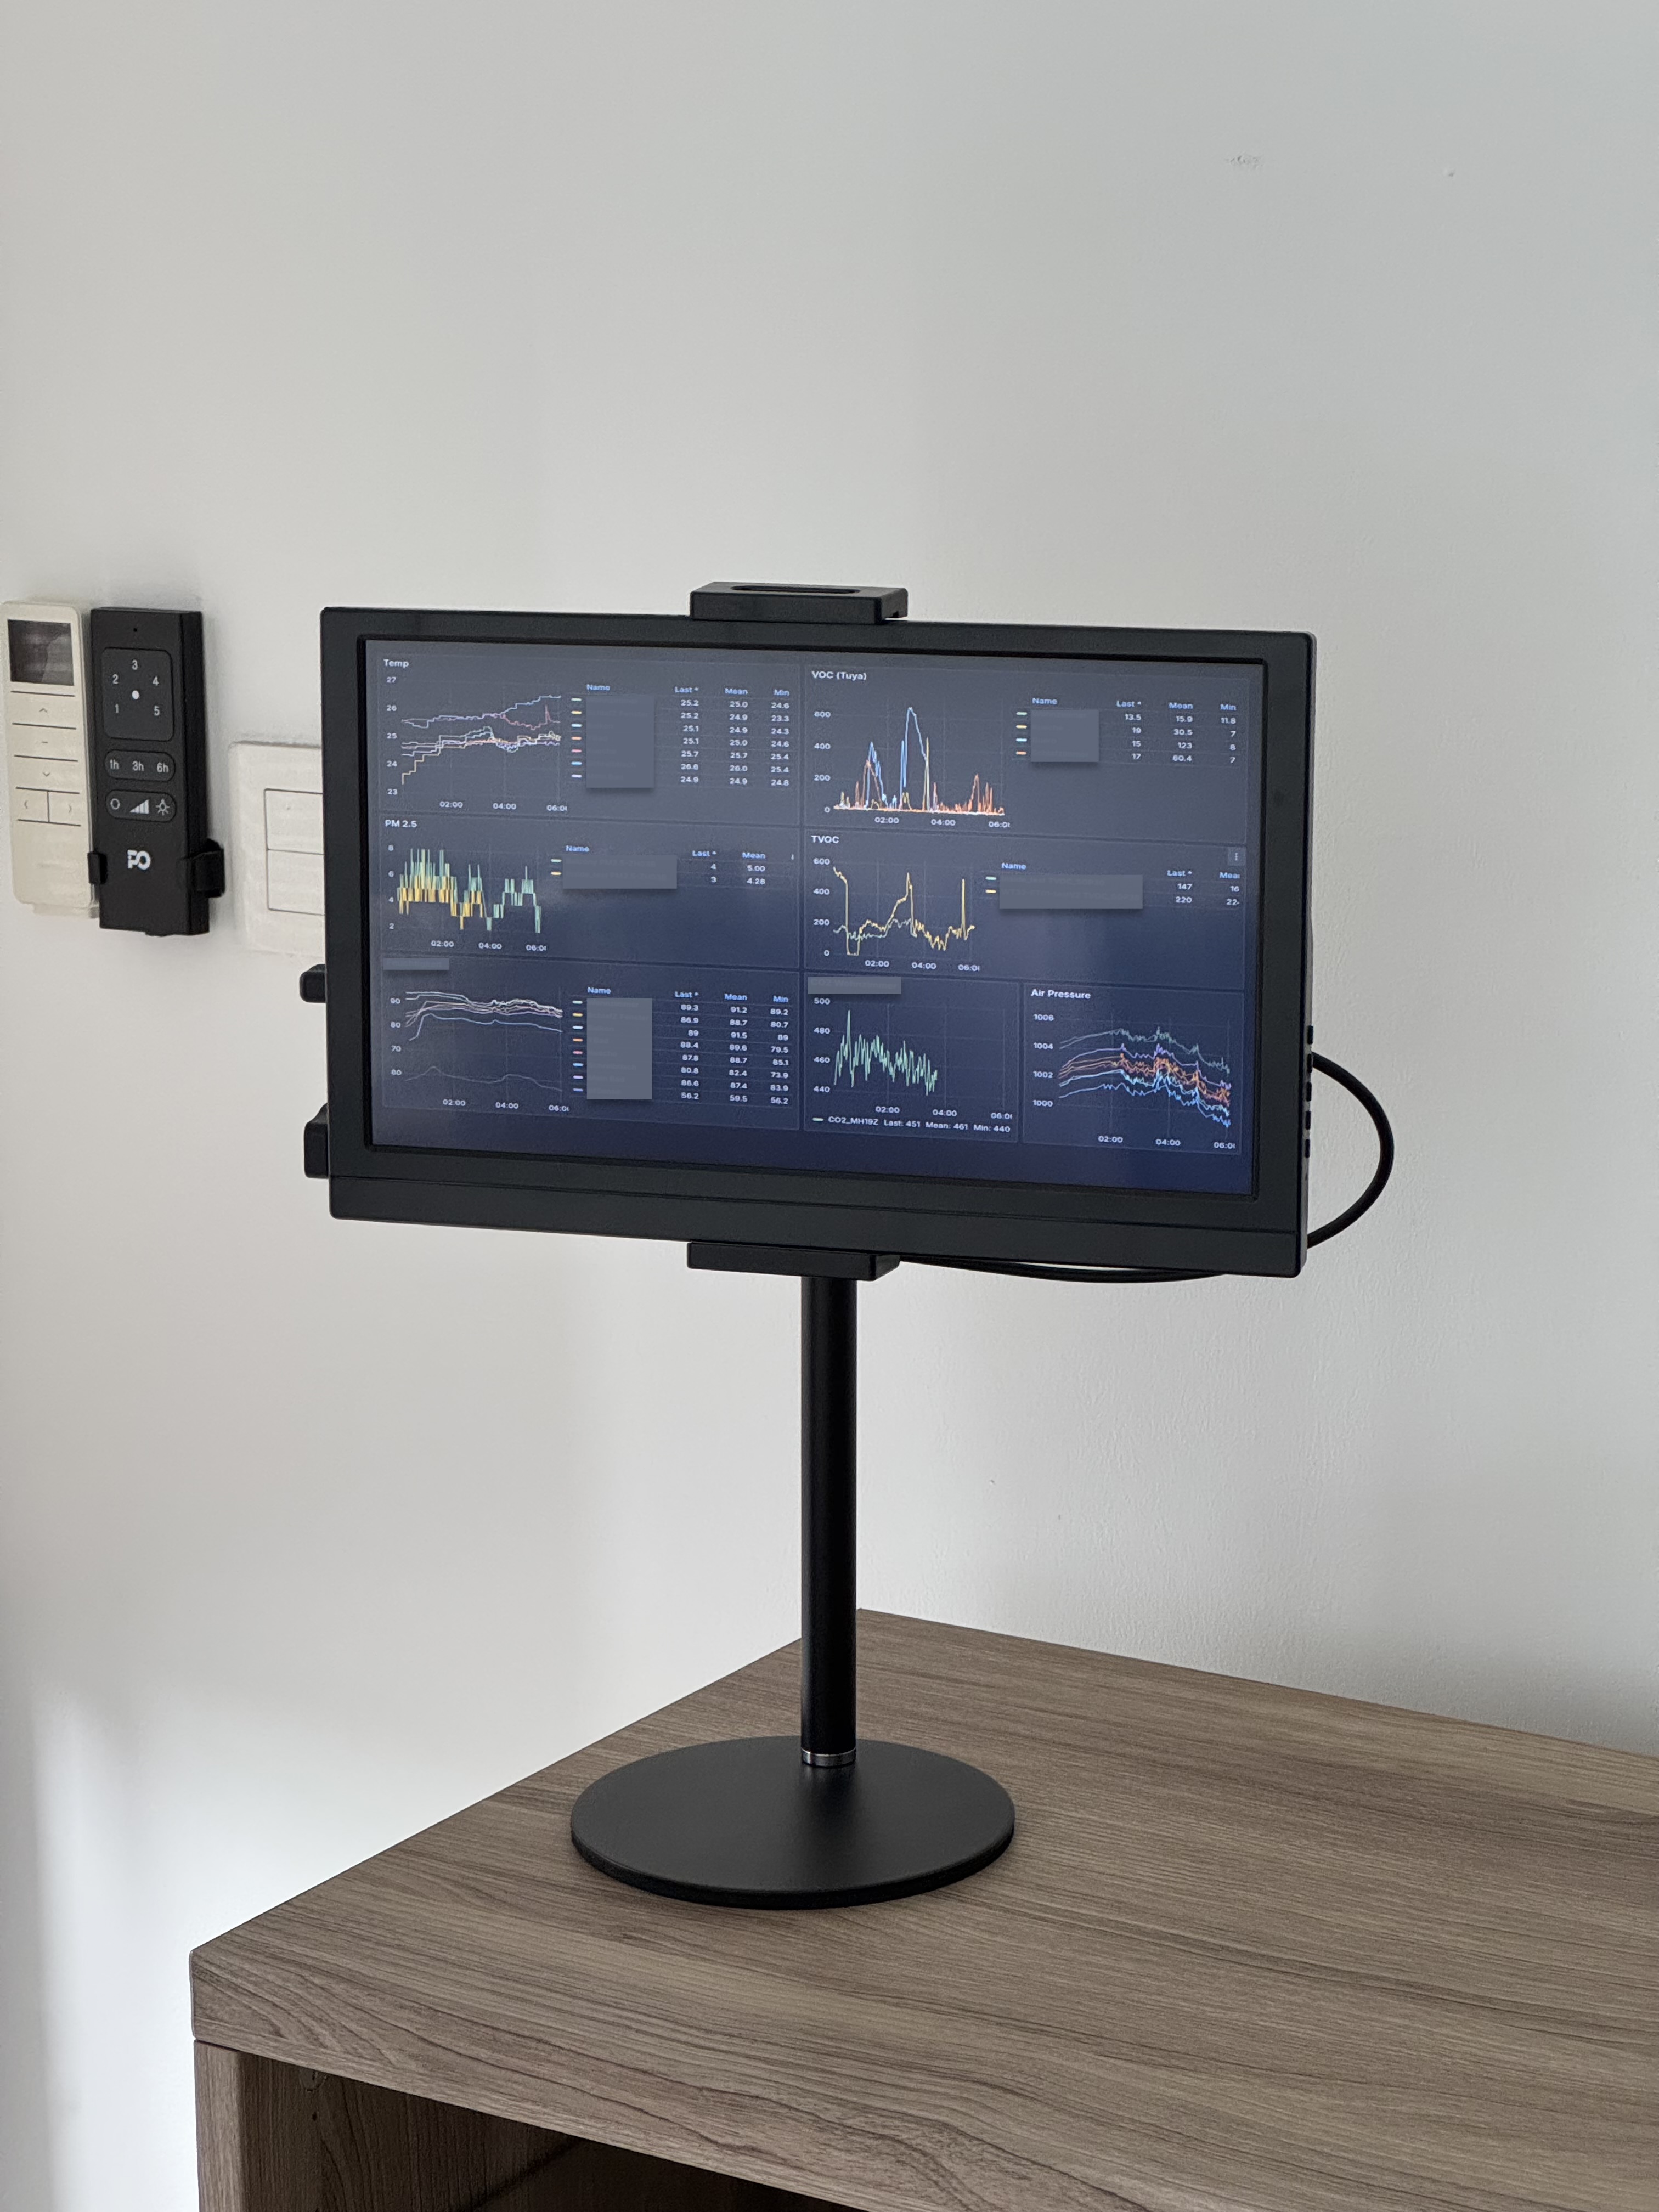
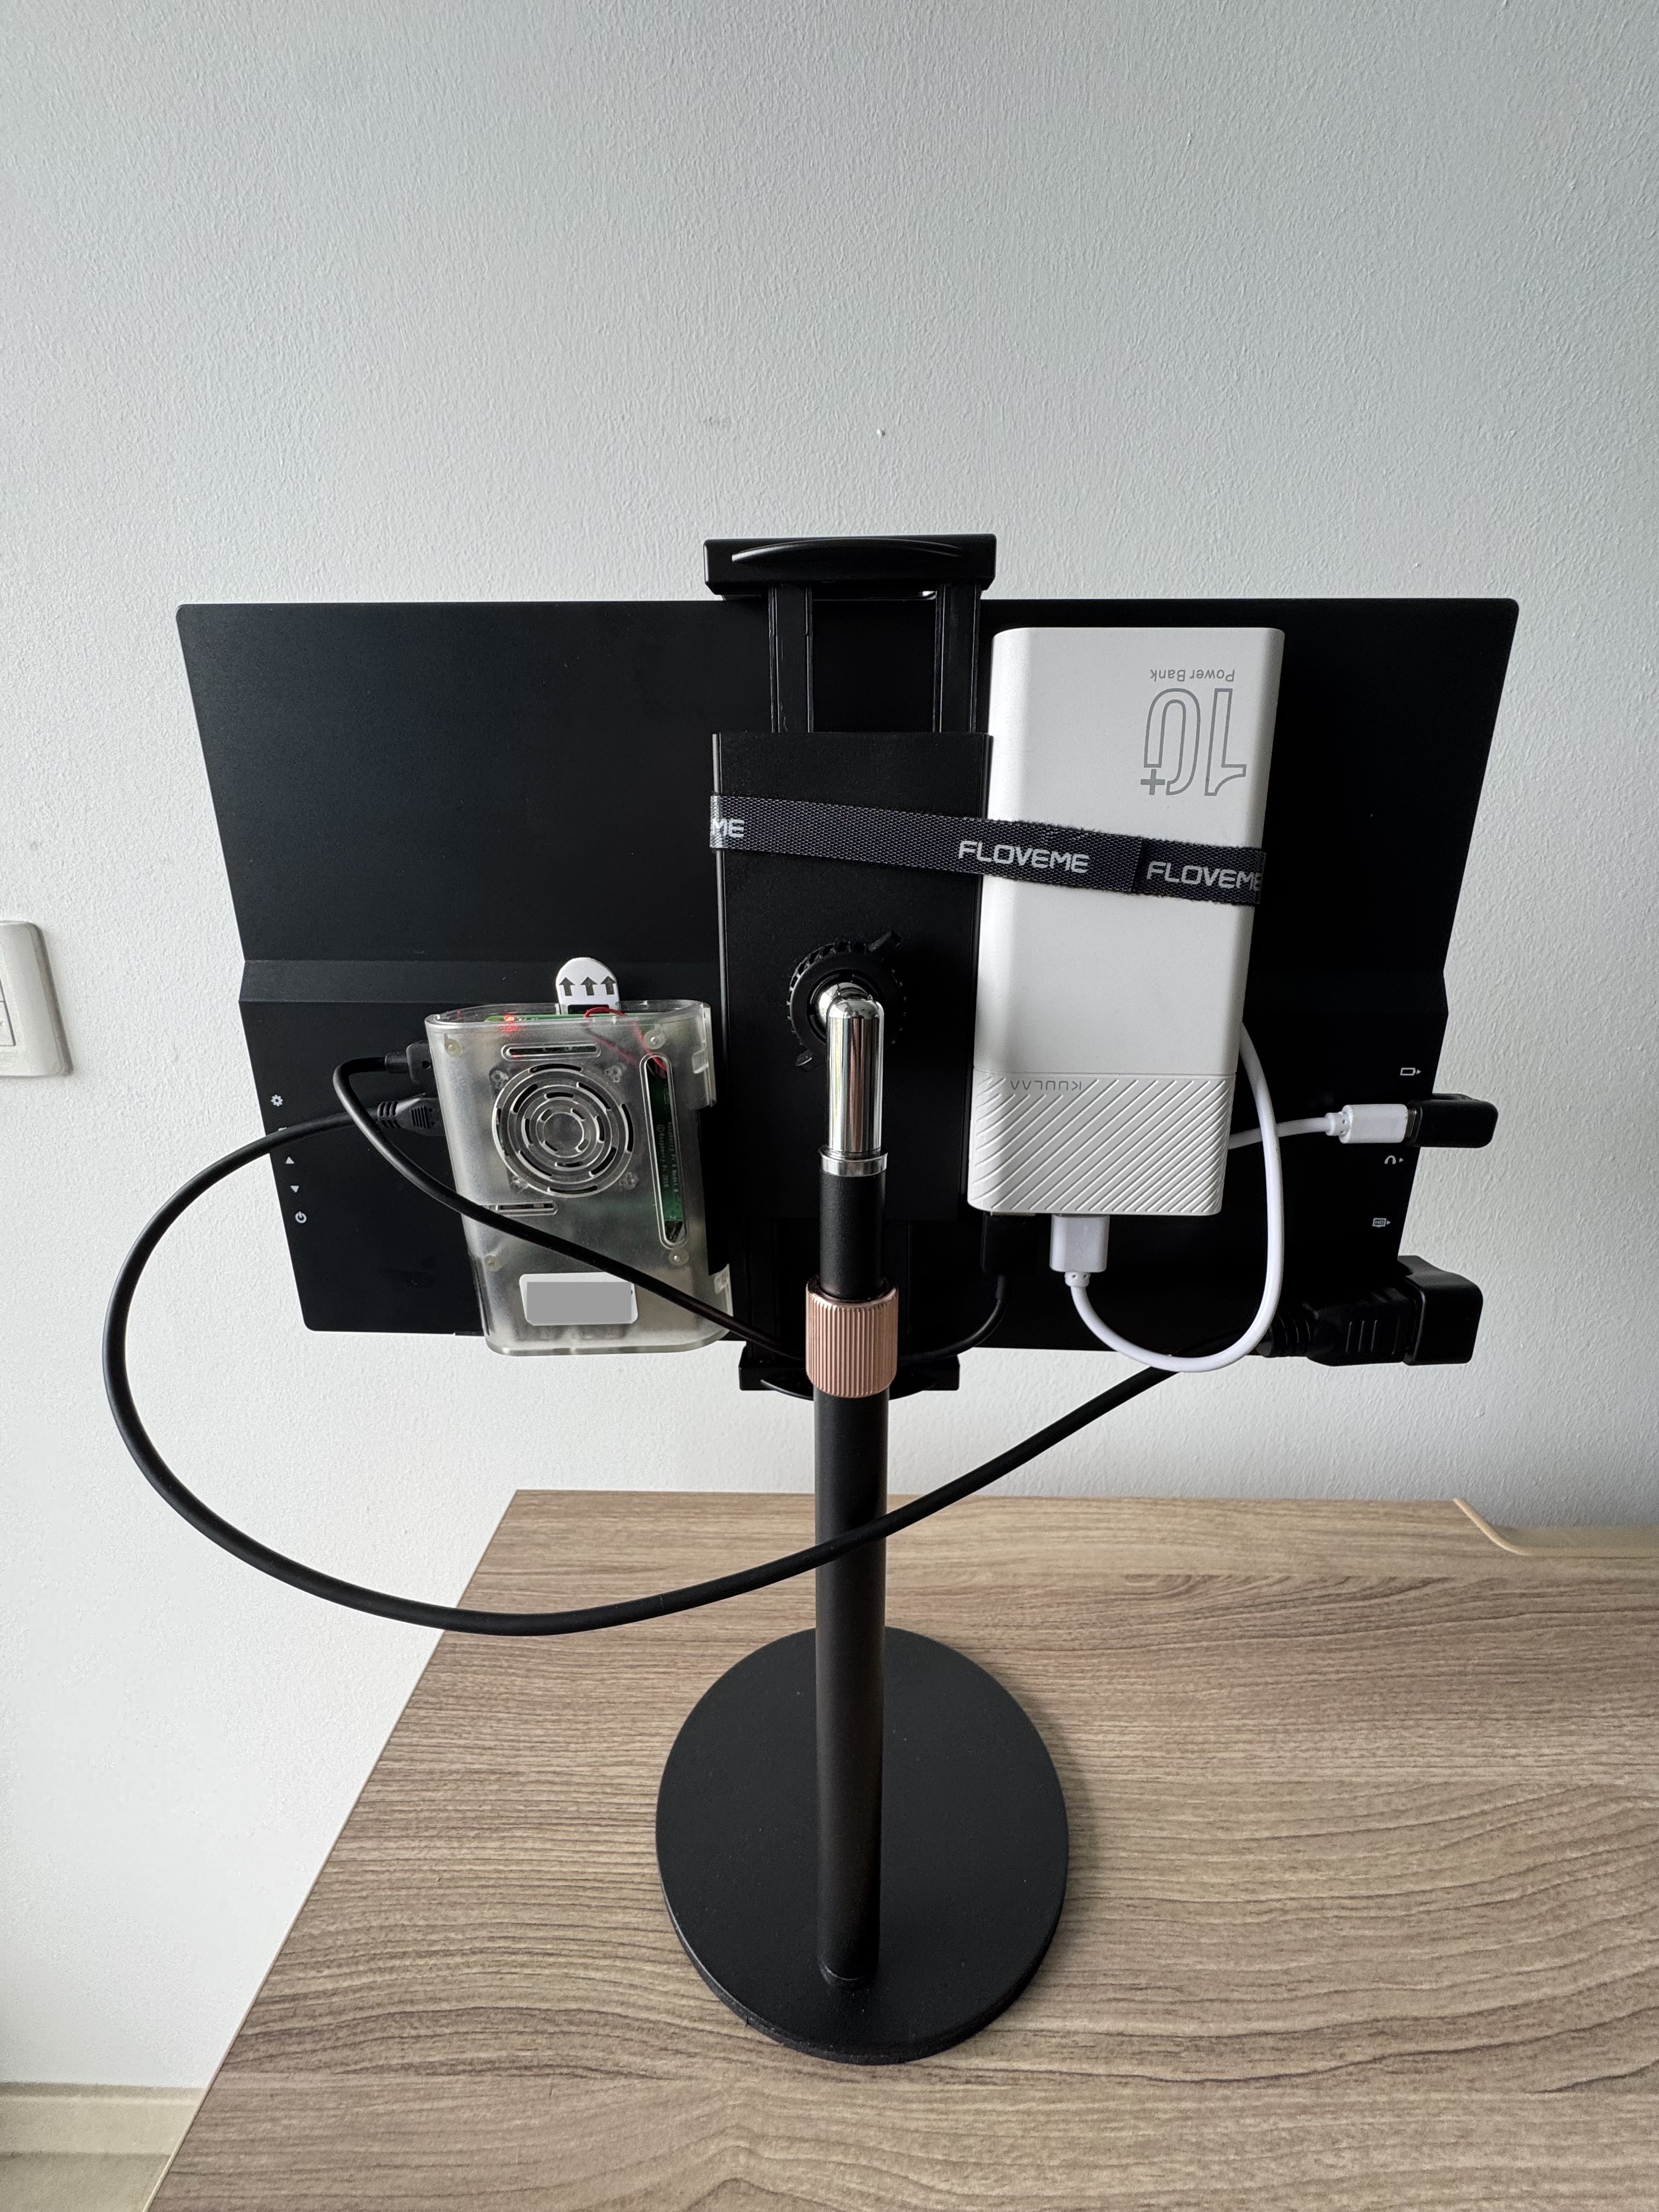
The first iteration of my standalone Grafana dashboard was designed to provide real-time insights into home environment metrics. Using a combination of Zigbee sensors, an ESP32 running ESPHome as a Zigbee gateway, a Raspberry Pi, and MQTT, I built a fully localized solution. Data from the Zigbee sensors flowed through Zigbee2MQTT to an MQTT broker (Mosquitto), then Telegraf subscribed to those MQTT topics and forwarded the data into InfluxDB, a time-series database, and finally Grafana visualized the metrics. This setup monitored key environmental parameters in real time, including:
✅ Temperature 🌡️
✅ Humidity 💧
✅ Air Quality Metrics 🌿 (PM2.5, TVOC, CO2)
Technical Setup
 |
 |
|---|
Core Components:
- Sensors: Zigbee-based temperature, humidity, and air quality sensors communicating via Zigbee2MQTT
- Gateway: ESP32 running ESPHome, acting as a local Zigbee hub
- Data Pipeline: MQTT broker (Mosquitto) handling sensor messages
- Database: InfluxDB for efficient, local time-series data storage
- Data Processing: Telegraf for subscribing to MQTT topics and pushing data to InfluxDB
- Visualization: Grafana (Docker container on Raspberry Pi) providing the dashboard interface
Advantages
- 100% Local Hosting: All components run on local hardware, ensuring data privacy and security.
- Real-Time Monitoring: Instant updates from sensors without cloud latency or dependencies.
- Historical Trends: InfluxDB stores long-term data, enabling visualization of trends over time.
- Custom Dashboards: Grafana’s flexibility allows tailoring the dashboard to home environment needs.
Evolution to Version 2.0: Bigger & Better
After successfully deploying Version 1.0, I saw opportunities for expansion. The next step? Enhanced visualization and additional monitoring capabilities. Enter Version 2.0!
🚀 Major Enhancements:
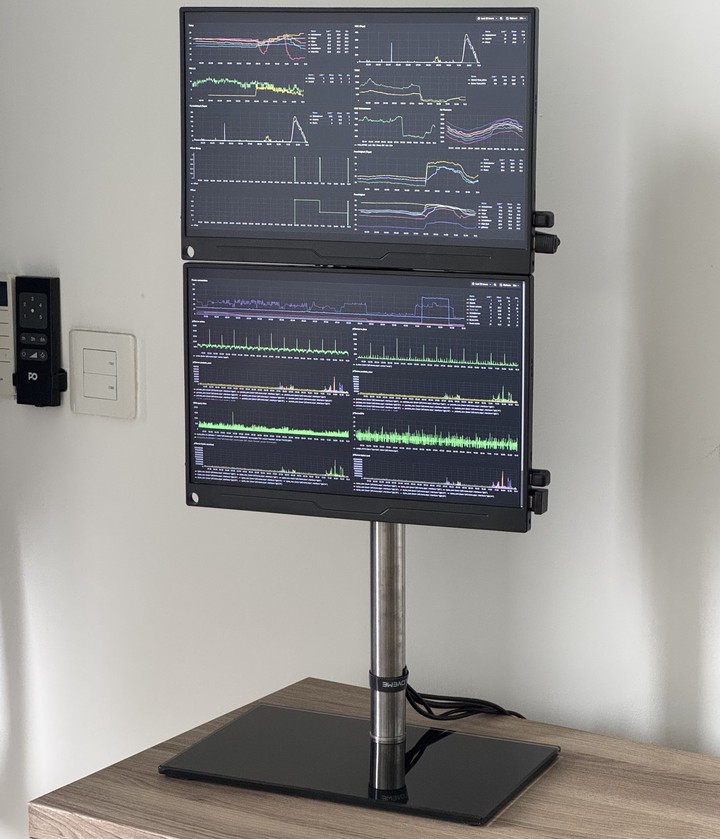
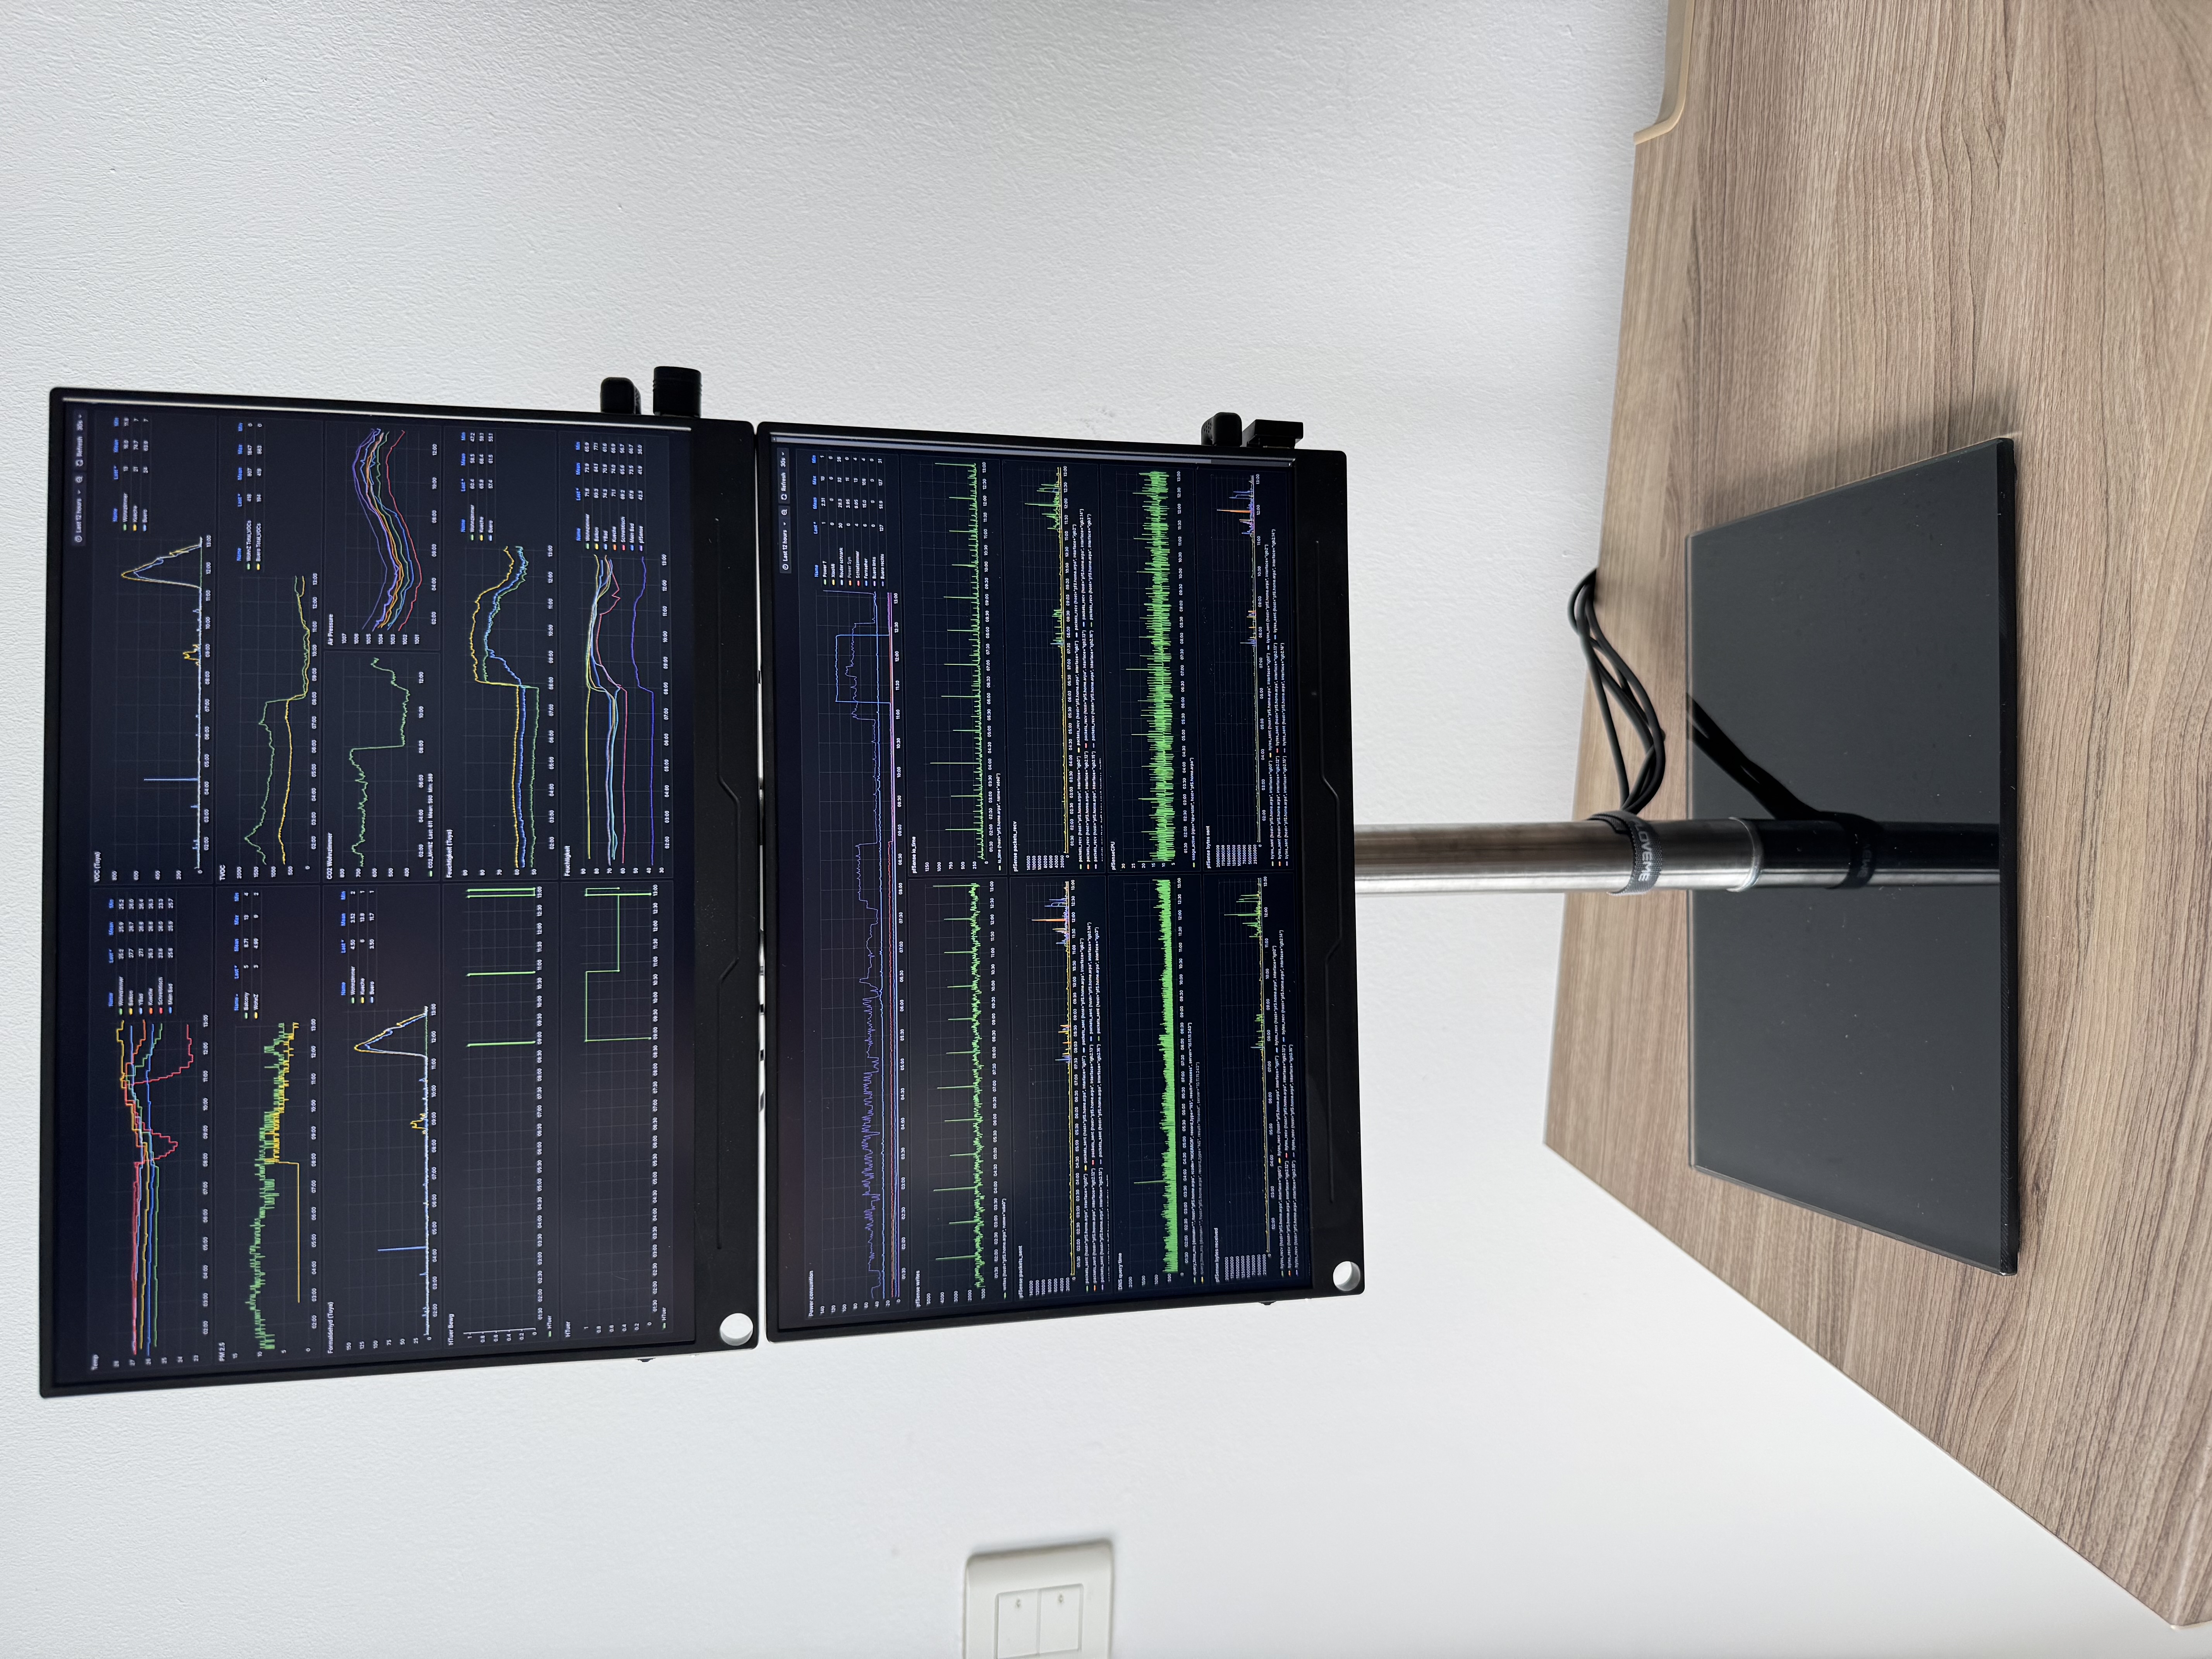
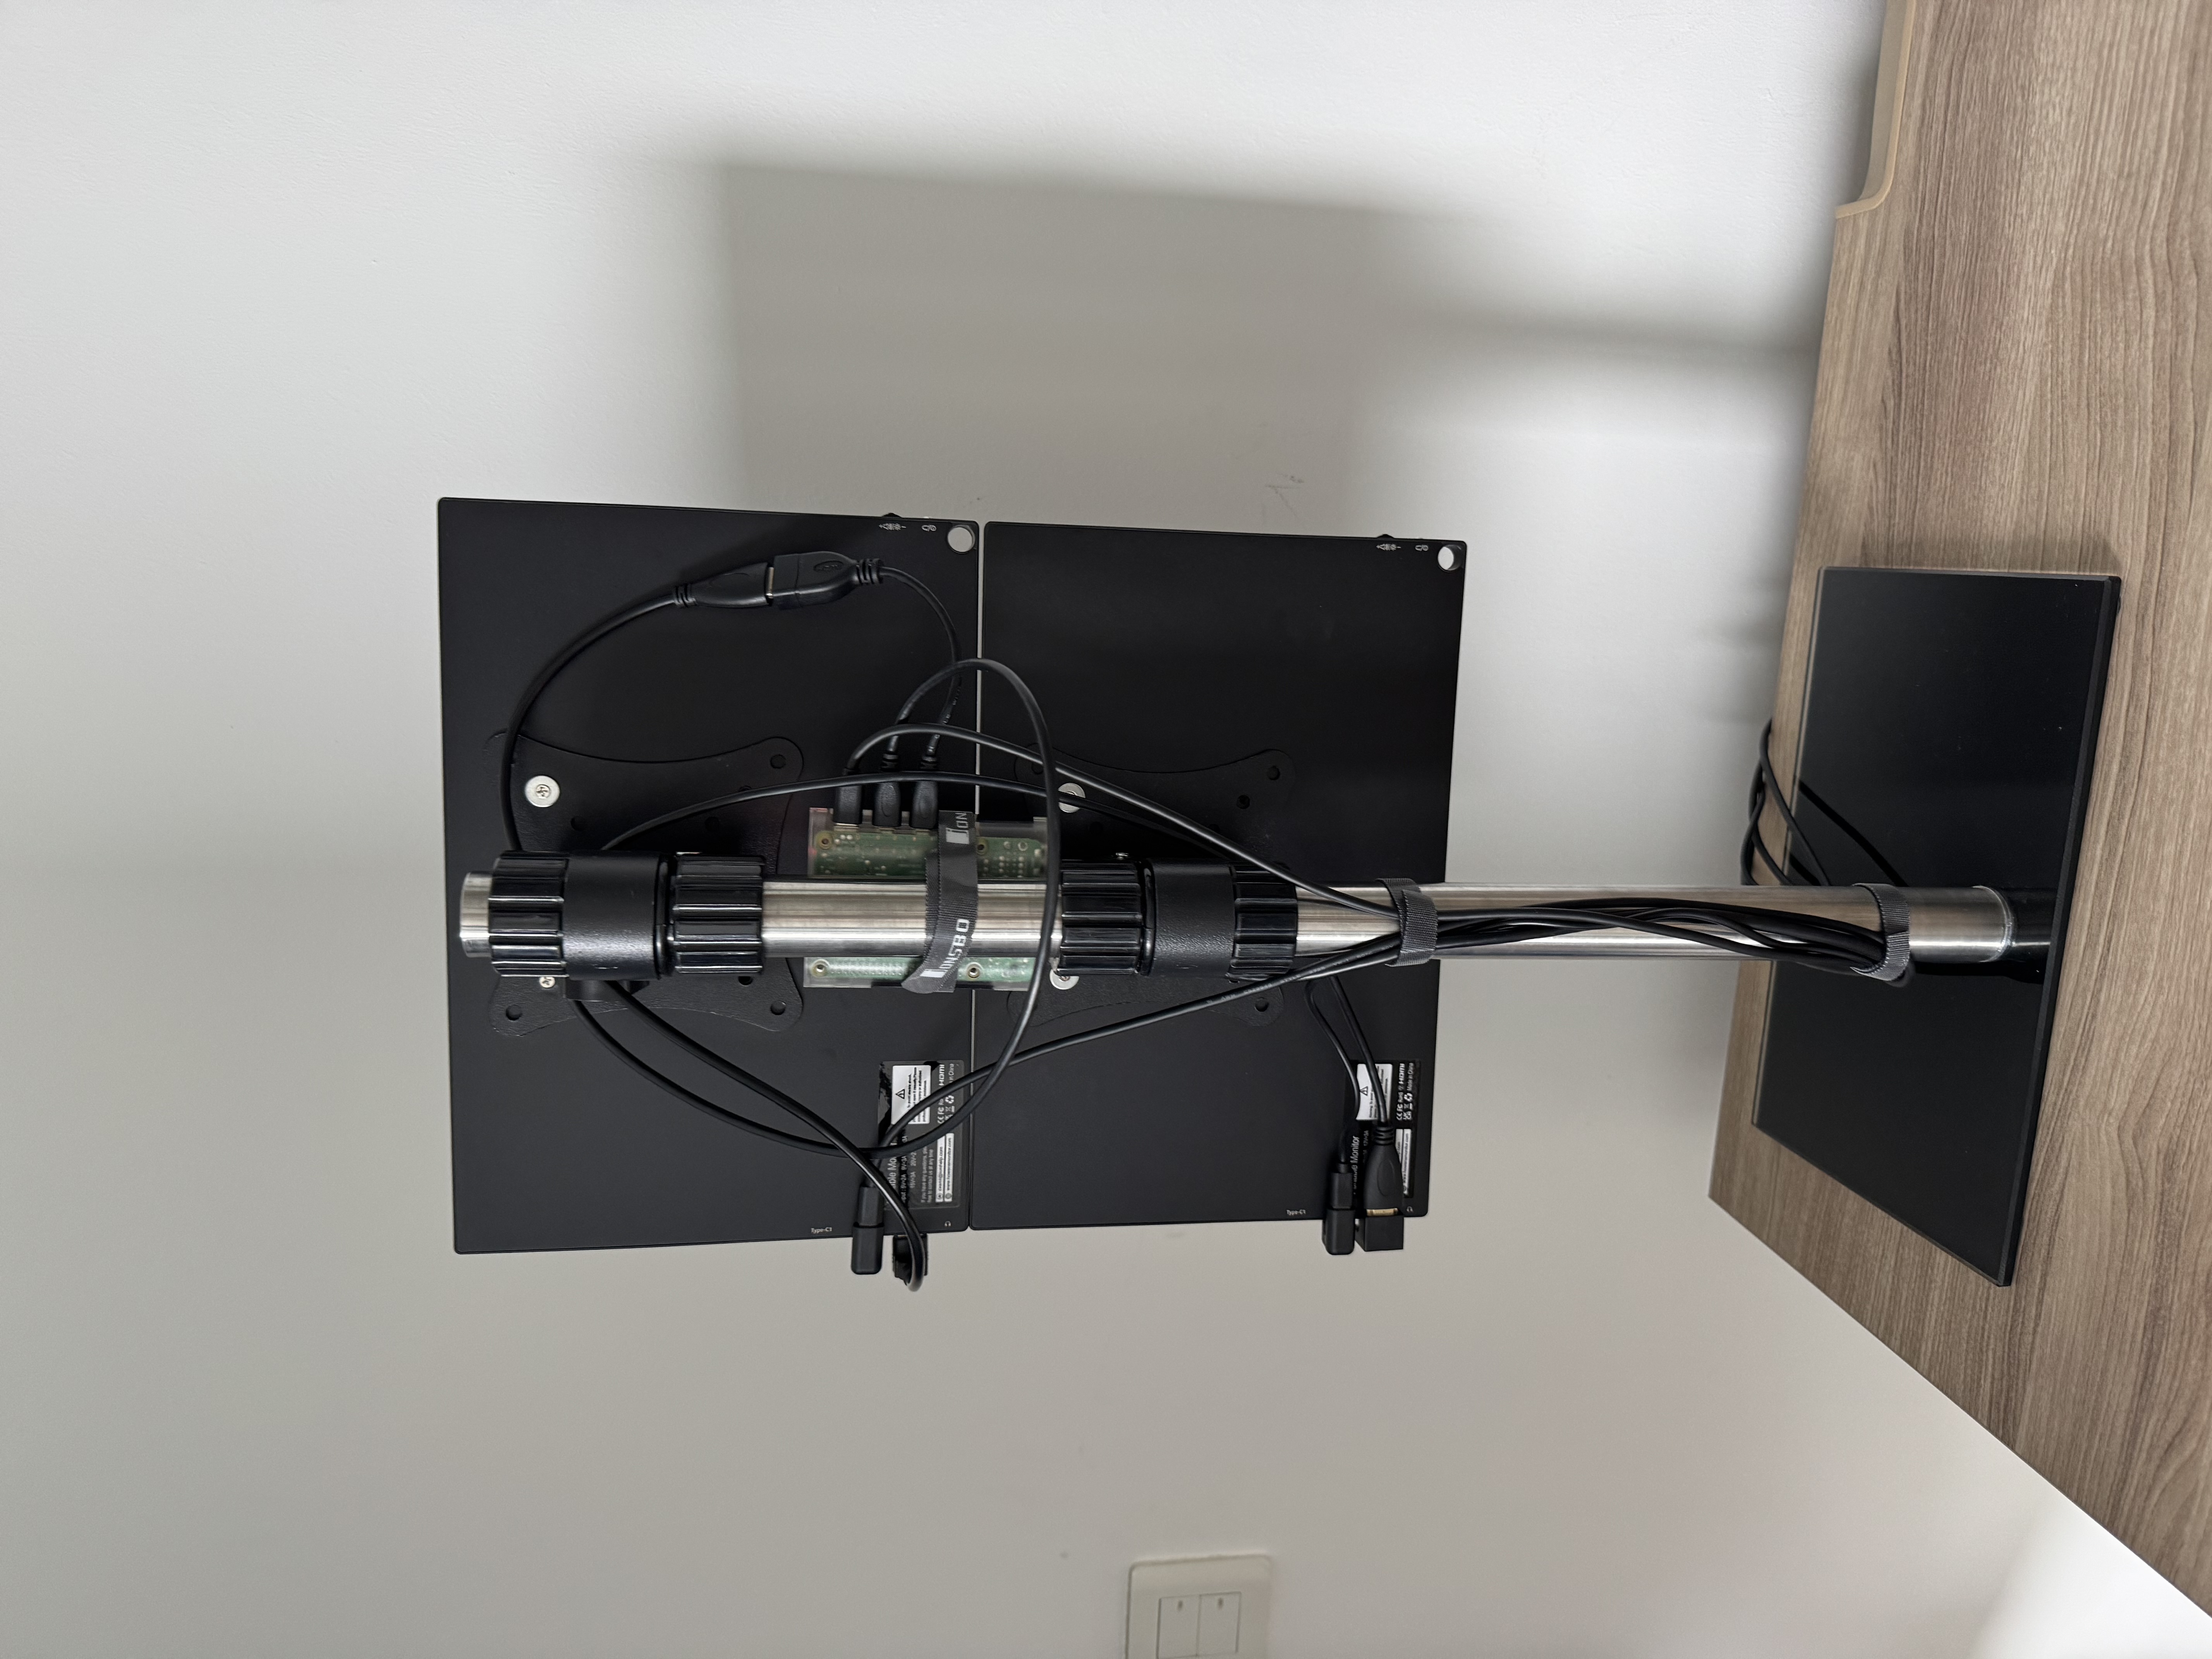
- Dual 13.3-inch 2560×1600 (2.5K) displays for significantly expanded screen real estate.
- Refined Multi-Page Dashboards: Dedicated views for climate, air quality, power, network, and server metrics.
- Additional Metrics Monitored:
- Power Consumption ⚡ (via smart plugs and energy monitors)
- Network Performance & DNS Statistics 🌐 (monitoring internet speed, latency, and DNS queries)
- Server and Infrastructure Health: CPU, RAM, disk usage, and uptime of home servers.
- Optimized Software Stack: Fine-tuned InfluxDB queries and Grafana panels for faster load times with more data.
Technical Setup for Version 2.0
 |
 |
|---|
| Component | Version 1.0 | Version 2.0 |
|---|---|---|
| Data Sources | Zigbee Sensors (Temp/Humidity/Air) | Zigbee Sensors + Smart Plugs + Network metrics |
| Display | Single 7-inch touch screen | Dual 13.3-inch 2.5K monitors |
| Database | InfluxDB (local Pi) | InfluxDB (optimized queries) |
| Visualization | Grafana (single dashboard) | Grafana (multiple dashboards & panels) |
| Hosting | Raspberry Pi (Docker) | Raspberry Pi + Proxmox VM (container) |
Advantages of Version 2.0
- Expanded Visualization: Dual screens allow multiple dashboards to be visible simultaneously, providing a comprehensive at-a-glance view.
- Higher Resolution: The 2560×1600 displays offer sharper, clearer visuals for improved data readability.
- More Metrics = Deeper Insights: Integration of power consumption and network performance metrics leads to a fuller picture of home status.
- Enhanced Performance: Optimized data queries ensure that even with larger datasets, the dashboard remains responsive and fast.
Practical Applications & Impact
This project is more than just a flashy dashboard—it’s a practical home automation monitoring system with real benefits:
- 🏠 Smart Home Optimization: Live climate data assists in fine-tuning HVAC settings, ensuring balanced temperatures throughout the home.
- ⚡ Energy Efficiency: Real-time power monitoring identifies energy consumption patterns, paving the way for smarter, cost-effective energy use.
- 🌐 Network Awareness: Monitoring network performance helps quickly diagnose and resolve connectivity issues.
- 📊 Data-Driven Insights: Historical data trends enable informed decision-making for home improvements and energy management.
Conclusion
From a simple monitoring dashboard in Version 1.0 to an advanced multi-metric home automation system in Version 2.0, this project demonstrates how continuous learning and iterative design lead to powerful outcomes. By leveraging Grafana, InfluxDB, and Docker, I’ve built a privacy-first, real-time solution that offers detailed insights without relying on cloud services.
What’s next? Future iterations may include AI-powered predictive analytics, automated control actions based on data trends, and even broader system integrations.